Groundwater Quality Trend Data Program
Groundwater Quality
Trend Data Program
Green County is starting a five year groundwater quality trend data project. It is one of the first counties in Wisconsin (and nationally) to use the process it is using. This is an exciting opportunity to learn more about groundwater in Green County. This multiyear process is specifically designed to get good data in order to better understand water quality in Green County.
Tracking groundwater quality trend data will help local officials and Green County residents make data-driven decisions when managing groundwater quality. Currently, little information exists that allows for an understanding of how groundwater quality has changed over time in Green County. Establishing a network of private well owners to perform annual testing over an extended period of time will help inform residents and local leaders whether groundwater quality is getting better, worse, or staying the same.
About the Tests
What Kinds of Tests are Being Taken?
Nitrate
Nitrate is a chemical commonly found in agricultural and lawn fertilizer. It is also produced when organic rich materials such as manure, bio-solids, septic system effluent, etc. decompose. Nitrate is a very soluble form of nitrogen and can easily leach past the root zone of plants into groundwater. Levels of nitrate in groundwater are generally less than 1 mg/L in natural or areas of little human influence. Elevated levels generally occur in areas of agricultural activity or areas of dense rural development (ie. small lot sizes with septic systems, lawn fertilizers, etc.). Soils and geology make certain areas more prone to nitrate losses to groundwater. For these reasons, nitrate is a good test to perform if trying to understand the impacts of land use on groundwater quality as well as trends over time.
Nitrate is an important test for private well owners. Levels greater than 10 mg/L nitrate-nitrogen should not be consumed by infants, or women who are / are trying to become pregnant.
Chloride
Like nitrate, chloride is a useful tool for understanding the impacts of land use. Major sources of chloride to groundwater include fertilizer, road salting and septic system drainfields. Potash is used to add potassium to soil. The most common form of potash is potassium chloride; the chloride is susceptible to leaching. Road salt (usually sodium chloride) helps in deicing roads, but is then washed off roads into ditches or other pervious areas where it soaks into the soil and can eventually leach to groundwater. Septic system drain fields dispose of wastewater which contains chloride from human waste and water softener salt.
Alkalinity
Alkalinity is a measure of water’s ability to neutralize acid. It is generated by the dissolution of carbonate minerals common to Wisconsin. Groundwater alkalinity measurements are relatively stable from one year to the next. Testing for alkalinity would help in understanding if a particular sampling event was influenced by rainfall or snow melt because alkalinity should be relatively consistent under normal conditions.
Where are Tests Occurring?
Well Selection and Recruitment
A total of 778 wells were selected as part of the initial recruitment (Figure 1, right). This assumed a response rate of approximately 35%. Wells were selected using a variety of datasets that included the Wisconsin Parcel Data Layer, Well Construction Records, Center for Watershed Science and Education Well Water Data, and others.
For the initial recruitment list, an attempt was made to locate at least one well owner per section with a Wisconsin Unique Well Number and could be matched to a landowner from the parcel data layer. All things being equal, preference was given to those landowners that participated in previous Extension well testing efforts. Most wells on the list have well depth, well casing, and water table information. Of the landowners that were contacted, 114 submitted a previous sample through Extension programming.
Recruitment materials consisted of a recruitment letter describing why the landowner was being contacted along with additional information about the project. Landowners were asked to respond using a pre-paid postcard. Recruitment materials were mailed in early November 2019.
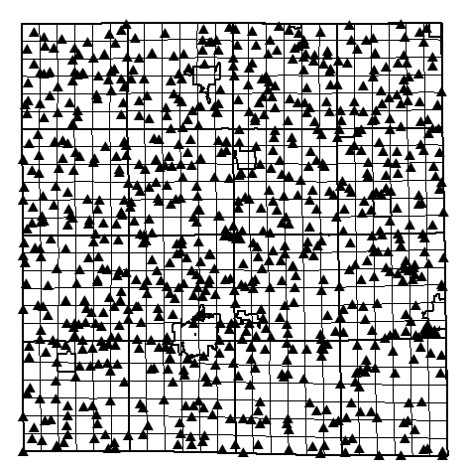
Figure 1.
Black triangles represent 770 well parcels that were mailed recruitment materials.
Recruitment Response/Participants
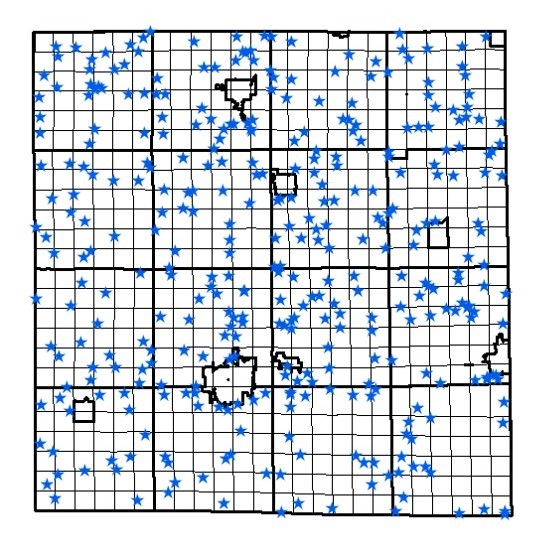
A total of 388 landowners indicated their willingness to participate in the well monitoring program (Figure 2, left). This is a success rate of 49.8%, higher than the initial estimate of 35%. Anticipating a drop in participation over the 5 year period, the Center for Watershed Science and Education plans to sample all 388 wells the first year in hopes that there is still a minimum of 240 well samples by the end of the final year of the project.
Figure 2.
The blue triangles indicate the location of well parcels (388 / 49.8%) that have agreed to participate.
Yearly Results
Green County has been tracking the groundwater quality in the area since 2019. Multiple years of data give a more expansive picture of the overall trend results throughout time. Here you can view the results summaries and other relevant information from the past years.
Year 1 (2019)
Each individual participating homeowner received their specific results back in April 2020. Kevin Masarik with the UW-Stevens Point Center for Watershed Science and Education, held a virtual educational session for participating homeowners in June 2020. A recording of that session is available: Green County Well Water Monitoring Program 2020. (YouTube Recording)
Learn About Year 1
Kevin also provided the Green County board with an annual report in July 2020. That report provides the aggregated data. Green County Board Annual Update Report – July 2020.pdf (14pgs)
Because 2020 was the first year with this multiyear program, the 2020 tests helped in getting an understanding of where things were currently at when it comes to nitrates in groundwater in Green County.
The Year 1 results are complete and were presented to the Green County Board on August 12, 2020. Please view the Presentation to Green County Board-Condensed Version 20200812.pdf (17pgs) for more information.
Read the Green County Well Water Monitoring Program’s Year One Results- Press Release.docx (2 pgs) regarding the results from Year 1 (2020) of this project.
Year 2 (2020)
In mid-November 2020, sample kits were mailed out to 342 participants. The deadline for returning the kits to the UW-Stevens Point Center for Watershed Science and Education was December 15, 2020. Approximately 314 tests were submitted, and participants received their individual test results in early February.
Learn About Year 2
Kevin Masarik, Groundwater Education Specialist with the UW-Stevens Point Center for Watershed Science and Education, held a virtual educational session for participating well owners in late February 2021. A recording of that session is available: Green County Groundwater Quality Trend Data Program Year 2 Presentation. (YouTube Recording)
Kevin also presented to the Green County Board on May 11, 2021 Presentation Slides: Green County Well Water Monitoring Program Year 2.pdf (30 pgs) and provided the Green County board with an annual report in June 2021. That report provides the aggregated data. Green County Board Annual Update Report — June 2021.pdf (16 pgs)
In addition to the report to the Green County Board is an interactive website (Green County Well Water Monitoring Project Website) that makes it possible to delve deeper into the results. Additional functionality will be added in 2021 that looks at relationships to various well factors (ex. casing depth, land-use, soils, geology).
Read the Green County Well Water Monitoring Program’s Year Two Results Press Release.docx (2 pgs) regarding the results from Year 2 of this project.
Year 3 (2021)
In mid-November 2021, sample kits were mailed out to 323 participants. The deadline for returning the kits to the UW-Stevens Point Center for Watershed Science and Education was October 22nd, 2021, all samples received before December 1st, 2021 were analyzed. A total of 307 samples were submitted, and participants received their individual test results in early February 2022.
Learn About Year 3
Kevin Masarik, Groundwater Education Specialist with the UW-Stevens Point Center for Watershed Science and Education website, held a virtual educational session for participating well owners in late February 2022. A recording of that session is available: Green County Groundwater Quality Trend Data Program Year 3 Presentation. (YouTube Recording)
Kevin presented to the Green County Board in June 2022 the Green County Well Water Monitoring Program 2021 Report Results.pdf (22 pgs) to share a report with aggregated data. He gave additional information with the Green County Board Water Trend Annual Updated Report June 2022.pdf (27 pgs). In addition to the report to the Green County Board is an interactive website (Green County Well Water Monitoring Project Website) that makes it possible to delve deeper into the results.
Year 4 (2022)
In mid-November 2022, sample kits were mailed out to 323 participants. All samples received before December 1st, 2022 were analyzed. A total of 294 samples were submitted, and participants received their individual test results in early February 2023.
Learn About Year 4
Kevin Masarik, Groundwater Education Specialist with the UW-Stevens Point Center for Watershed Science and Education, held a virtual educational session for participating well owners in late February 2023.
Kevin presented to the Green County Board in June 2023 the Green County Well Water Monitoring Program 2022 Report Results to share a report with aggregated data. He gave additional information with the Green County Board Water Trend Annual Updated Report June 2023. In addition to the report to the Green County Board is an interactive website (Green County Well Water Monitoring Project Website) that makes it possible to delve deeper into the results.
Year 5 (2023)
In mid-November 2023, sample kits were mailed out to participants. A total of 269 samples were submitted in Year 5 (2023). All samples were analyzed for nitrate-nitrogen, chloride, pH, alkalinity, total hardness, and conductivity. Participants received their individual test results in early 2024.
Learn About Year 5
Kevin Masarik, Groundwater Education Specialist with the UW-Stevens Point Center for Watershed Science and Education website, presented to the Green County Board in June 2024 regarding the results.
About the Groundwater Quality Trend Data Grassroots Program
The Green County Groundwater Quality Trend Data Grassroots program is a program designed for private well owners. The goal of this program is to assist individual well owners and communities interested in annual testing with the goal of better tracking well water quality over time.
By participating in the program, you will join a network of county-wide wells whose yearly testing results will contribute to understanding the overall groundwater quality in Green County. Your well’s specific results and information will not be shared with any other participants – only you and the lab will be able to access the details of your results.
See the Groundwater Quality Trend Data Grassroots Program Flyer.pdf for more information!
Other Resources
For more information on understanding groundwater in Green County, check out these resources and educational centers to learn more!
Groundwater Resources
Groundwater Resources
- Green County: Groundwater 101 Presentation.pdf (71 pgs)
- Green County Geology and Groundwater.pdf (29 pgs)
- Green County Summary of Groundwater Resources and Susceptibility Presentation.pdf (70 pgs)
- Green County Bedrock Map.pdf (1 pg)
- Green County Bedrock Geology Map.pdf (1 pg)
- Green County Groundwater Susceptibility Map.pdf (1 pg)
- Green County Groundwater Recharge Map.pdf (1 pg)
- Green County Water Table Map.pdf (1 pg)
- Educational Session Recordings (YouTube Videos)
Questions? Contact:
Jordyn Sattler, Regional Crops and Soils Educator, at (608) 328-9440 or jordyn.sattler@wisc.edu.